Scan the artwork above with Artivive to view my project in augmented reality. To get started, Download Artivive on your mobile device!
Choose a state
Observe its unique red level
Breathe in time with the state
In and out
In and out
In and out . . .
Are you light headed?
Hyperventilating?
Relaxed?
Is the red level high?
Or is it low?
States Breathing is an artwork that visualizes the relationship between state CO2 emissions and state citizen Off Highway Vehicle (OHV) use through movement and graphic design. My project began with a Forest Service study on the percentage of each U.S. state population that participated in OHV recreation in 2007. As an avid dirt bike rider, I have always wondered how much of an impact dirt bike and other OHV use has on overall CO2 emissions. After some research, I paired the Forest Service data with a U.S. Energy Information Administration study on state CO2 emissions per capita with specific data from 2007. Initially, I was searching for evidence of OHV use having little impact on the levels of CO2 emissions in each state, so I could feel excused from environmental concerns while dirt biking. As I created several tables putting OHV use and CO2 emissions for each state side by side, my initial assumption faltered. A relatively consistent pattern of high percentage of OHV participants correlated with high CO2 levels and low OHV use with low CO2 levels began to appear. There are naturally many exceptions to this pattern, so the viewer will have to draw their own conclusions on the correlations of these two data sets through my artwork.
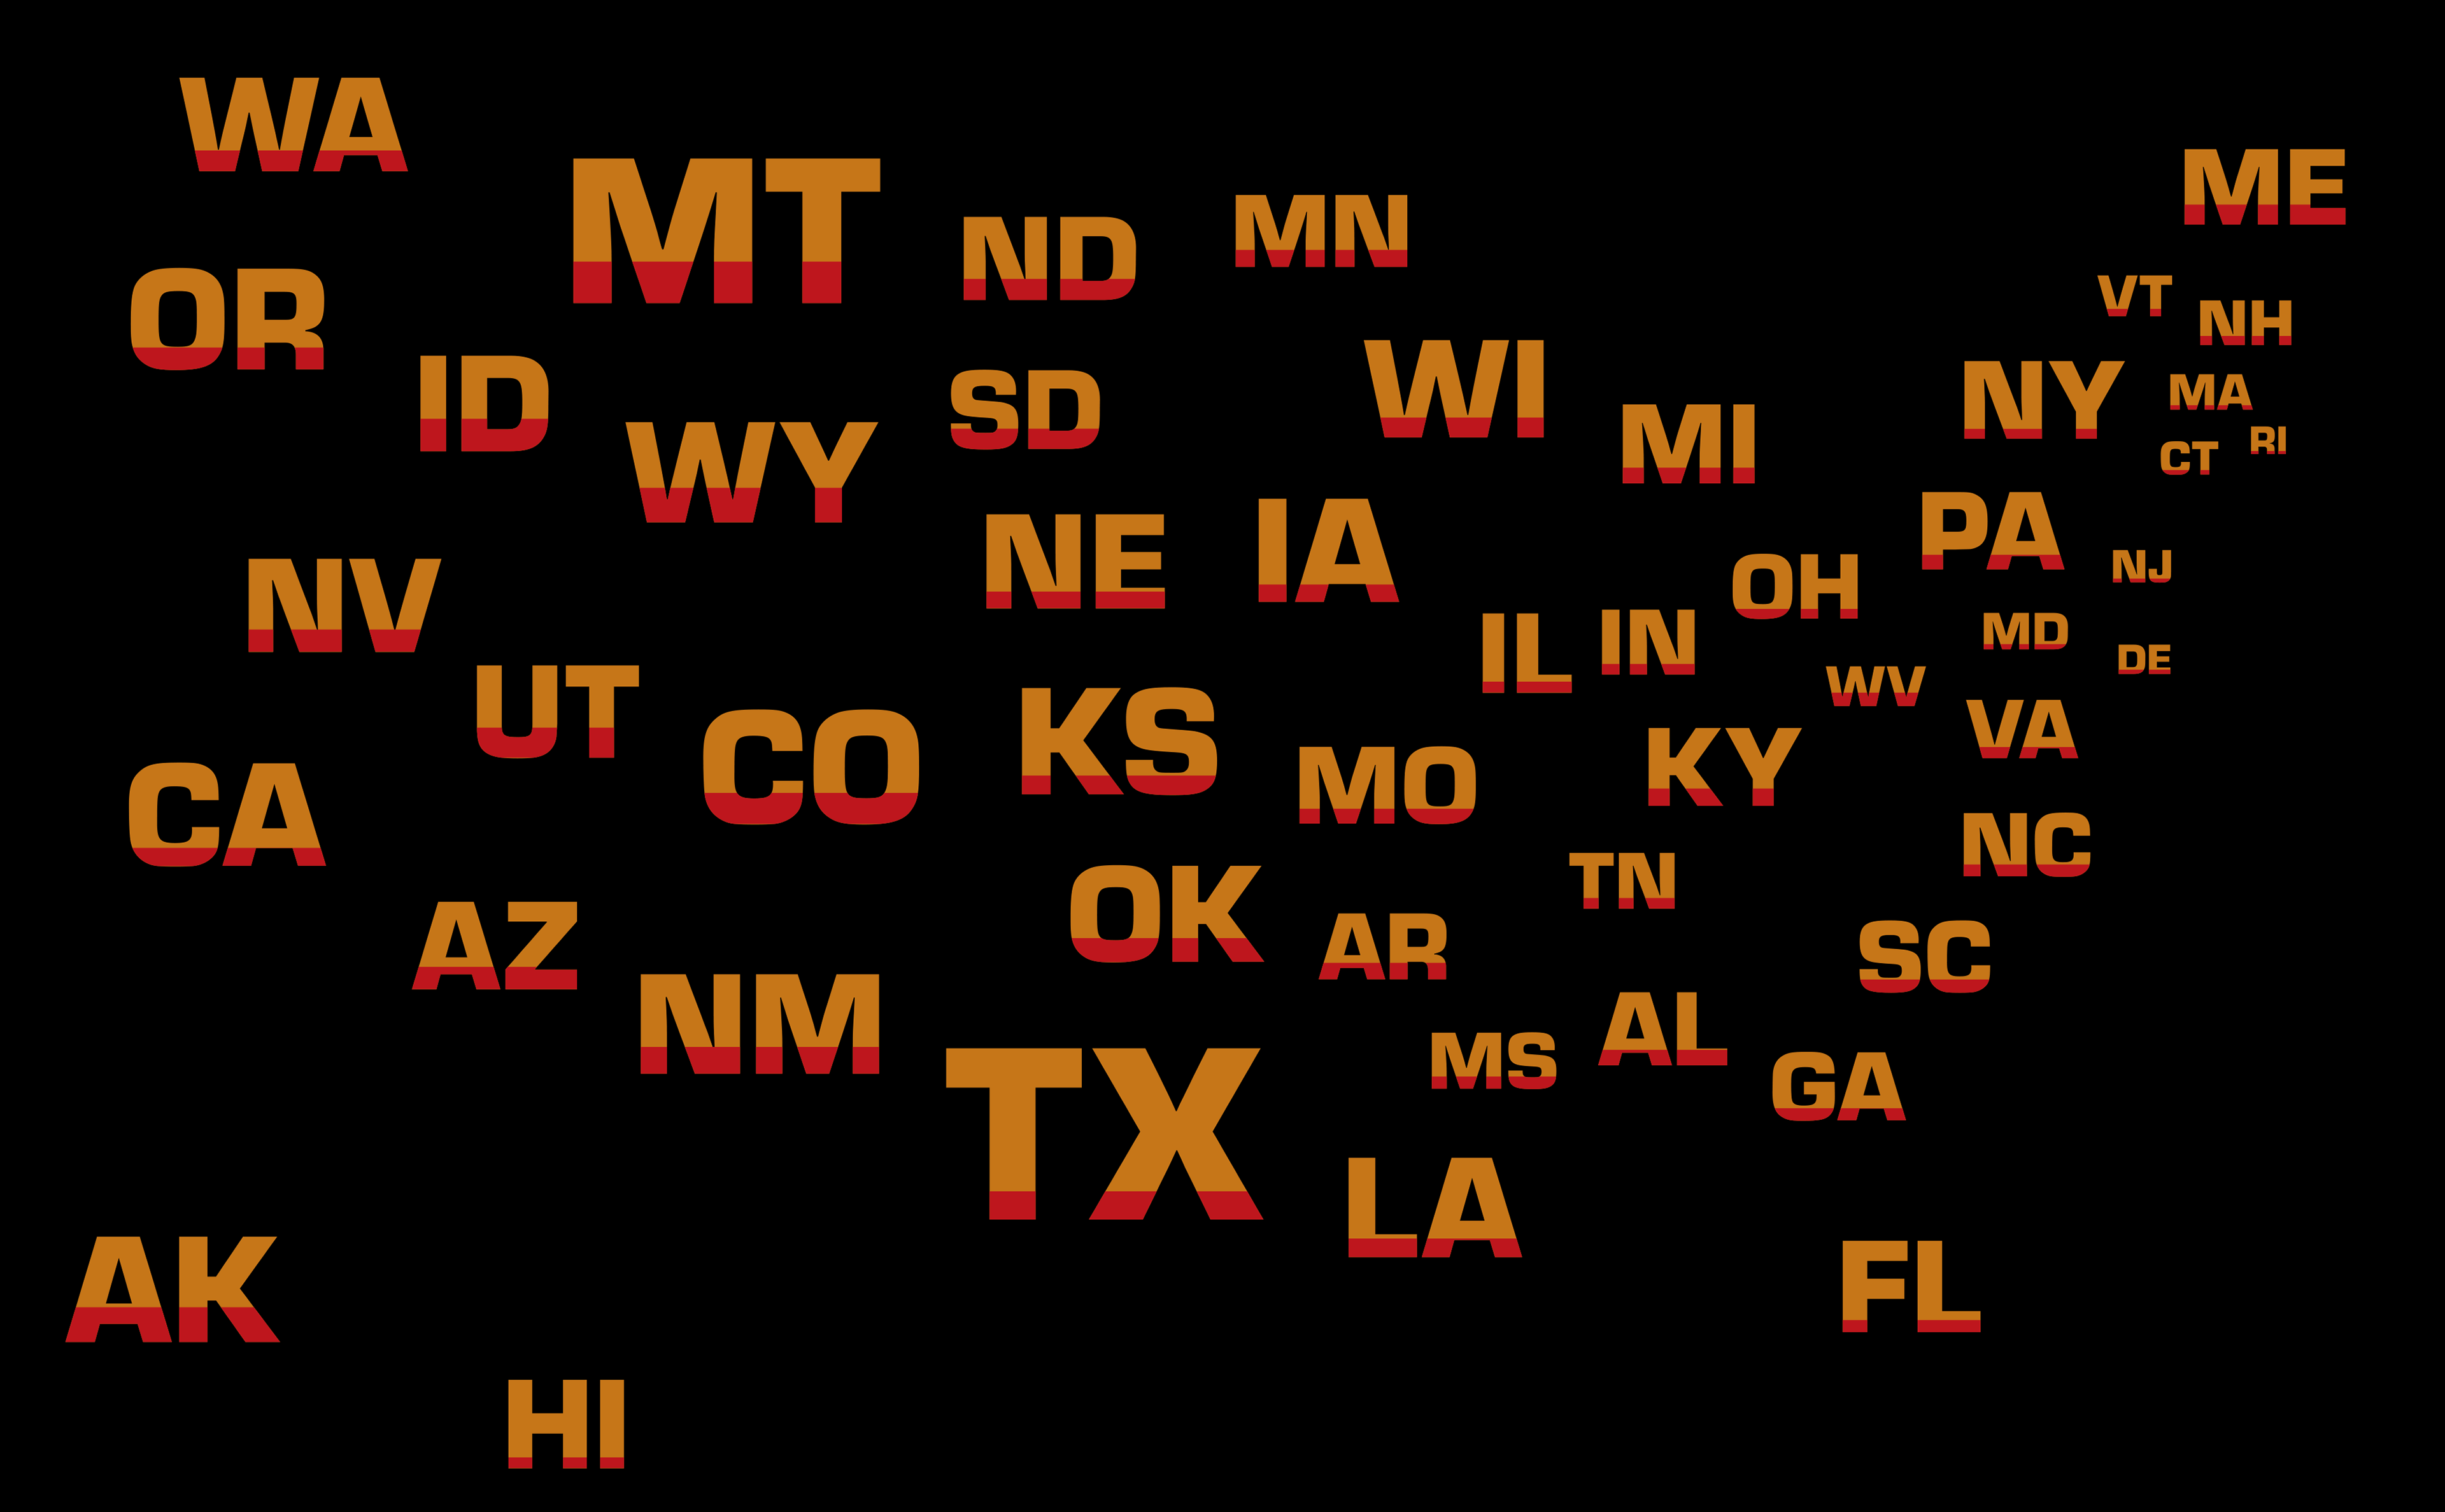
Each of the 50 U.S. states is represented by their two letter abbreviation and the percentage of citizens participating in OHV recreation is shown by an identical percentage of the graphic flooded with red. The color palette, yellow and red, was inspired by the popular colors of OHV company branding such as Honda and Fly Racing. The CO2 levels per capita in each state is represented by breathing or animations of the state abbreviation scaling up and down. The number of million metric tons of CO2 exactly equals the number of breaths per minute. This equation results in a fascinating visual metaphor: high CO2 emissions result in labored breathing while a state with low CO2 emissions breathes slowly as if in a deep sleep. I arranged all of these animations according to geographic location with the size of the state abbreviation being the approximate relative size of the actual state. Finally, I created a layered artwork in Artivive that allows my final piece to be viewed in augmented reality. The suspense of my piece is finally realized when the viewer scans a still of the state abbreviations and it automatically animates on their device to show the unique, conflicting breathing rates of our states.
Project Progress
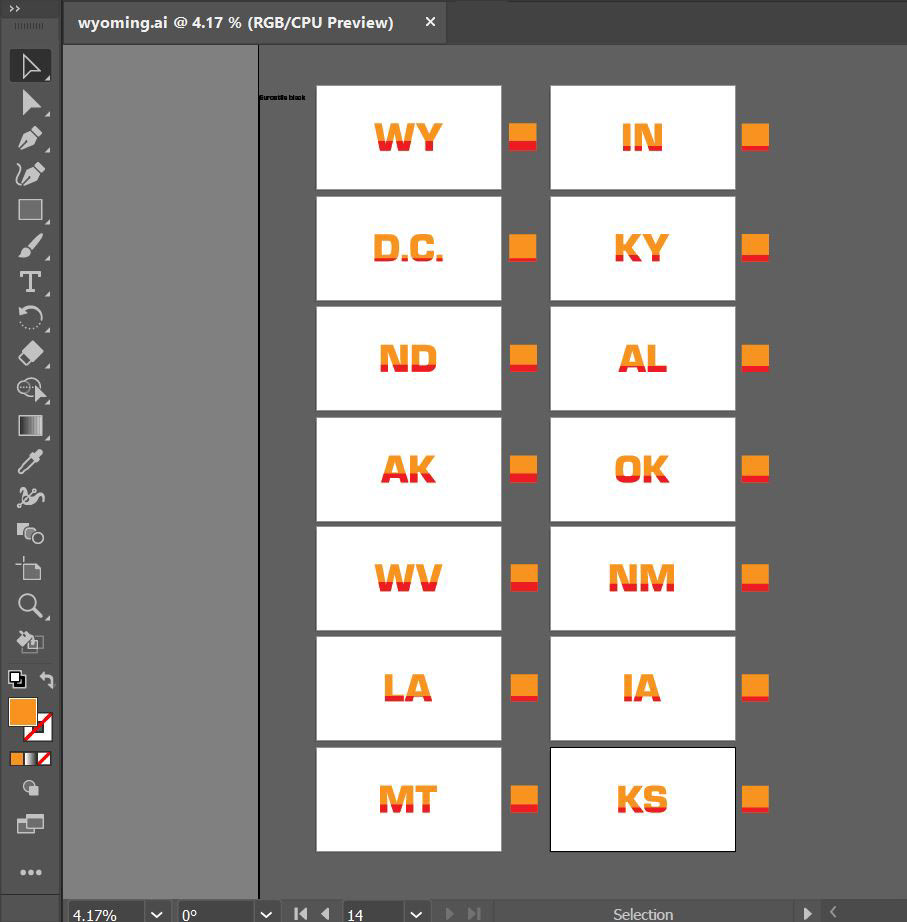
state graphics progress 1
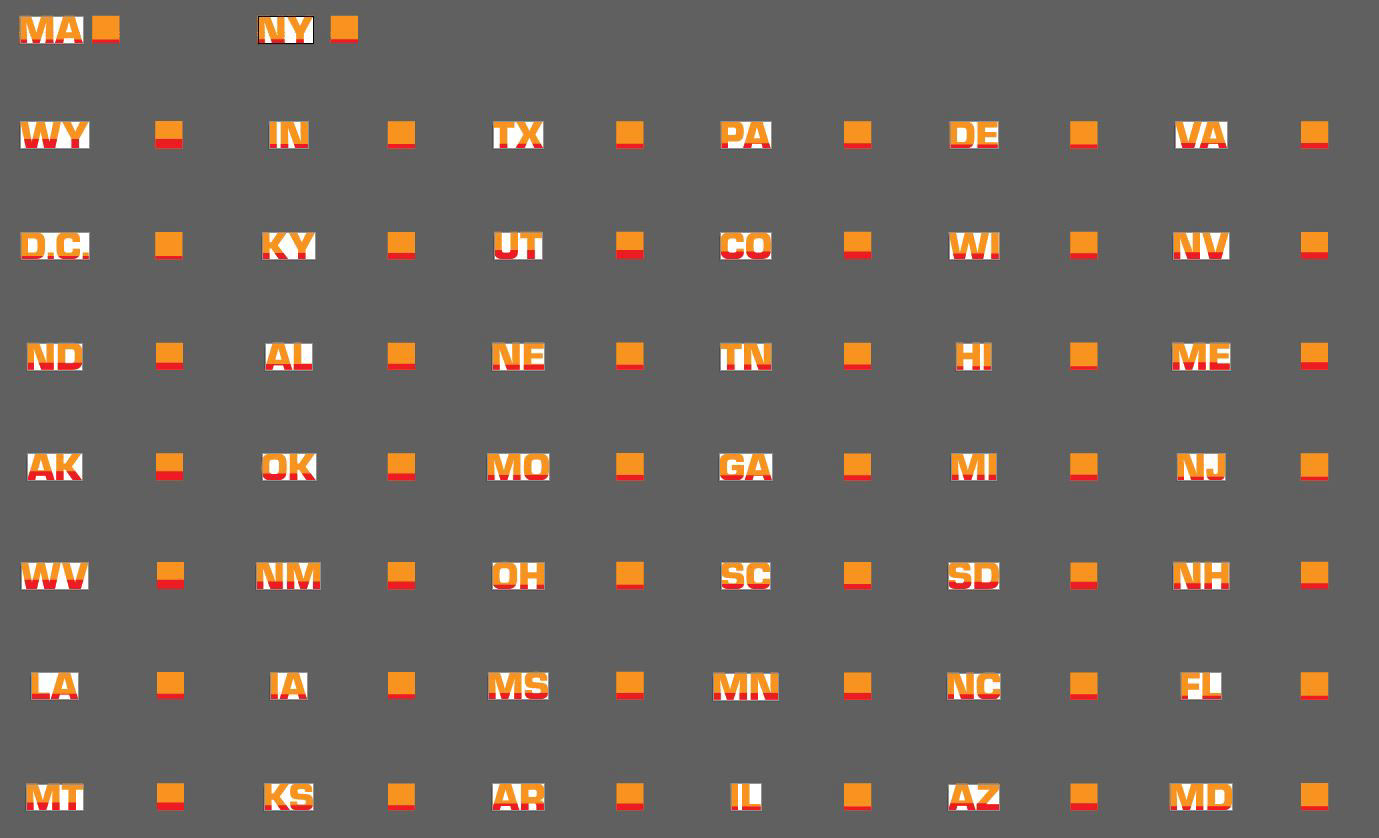
state graphics progress 2
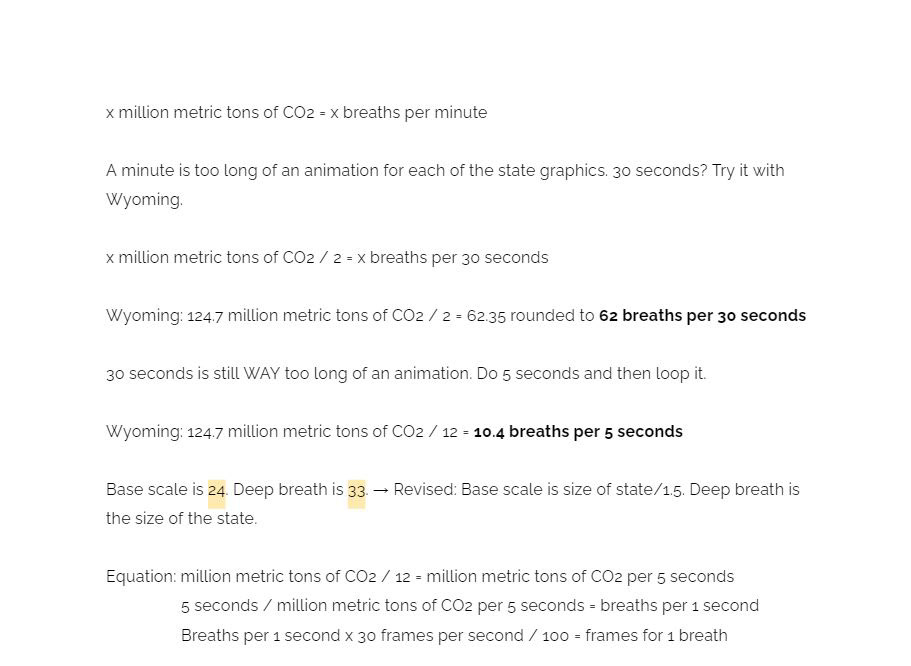
brainstorming the equation of breathing to CO2 levels
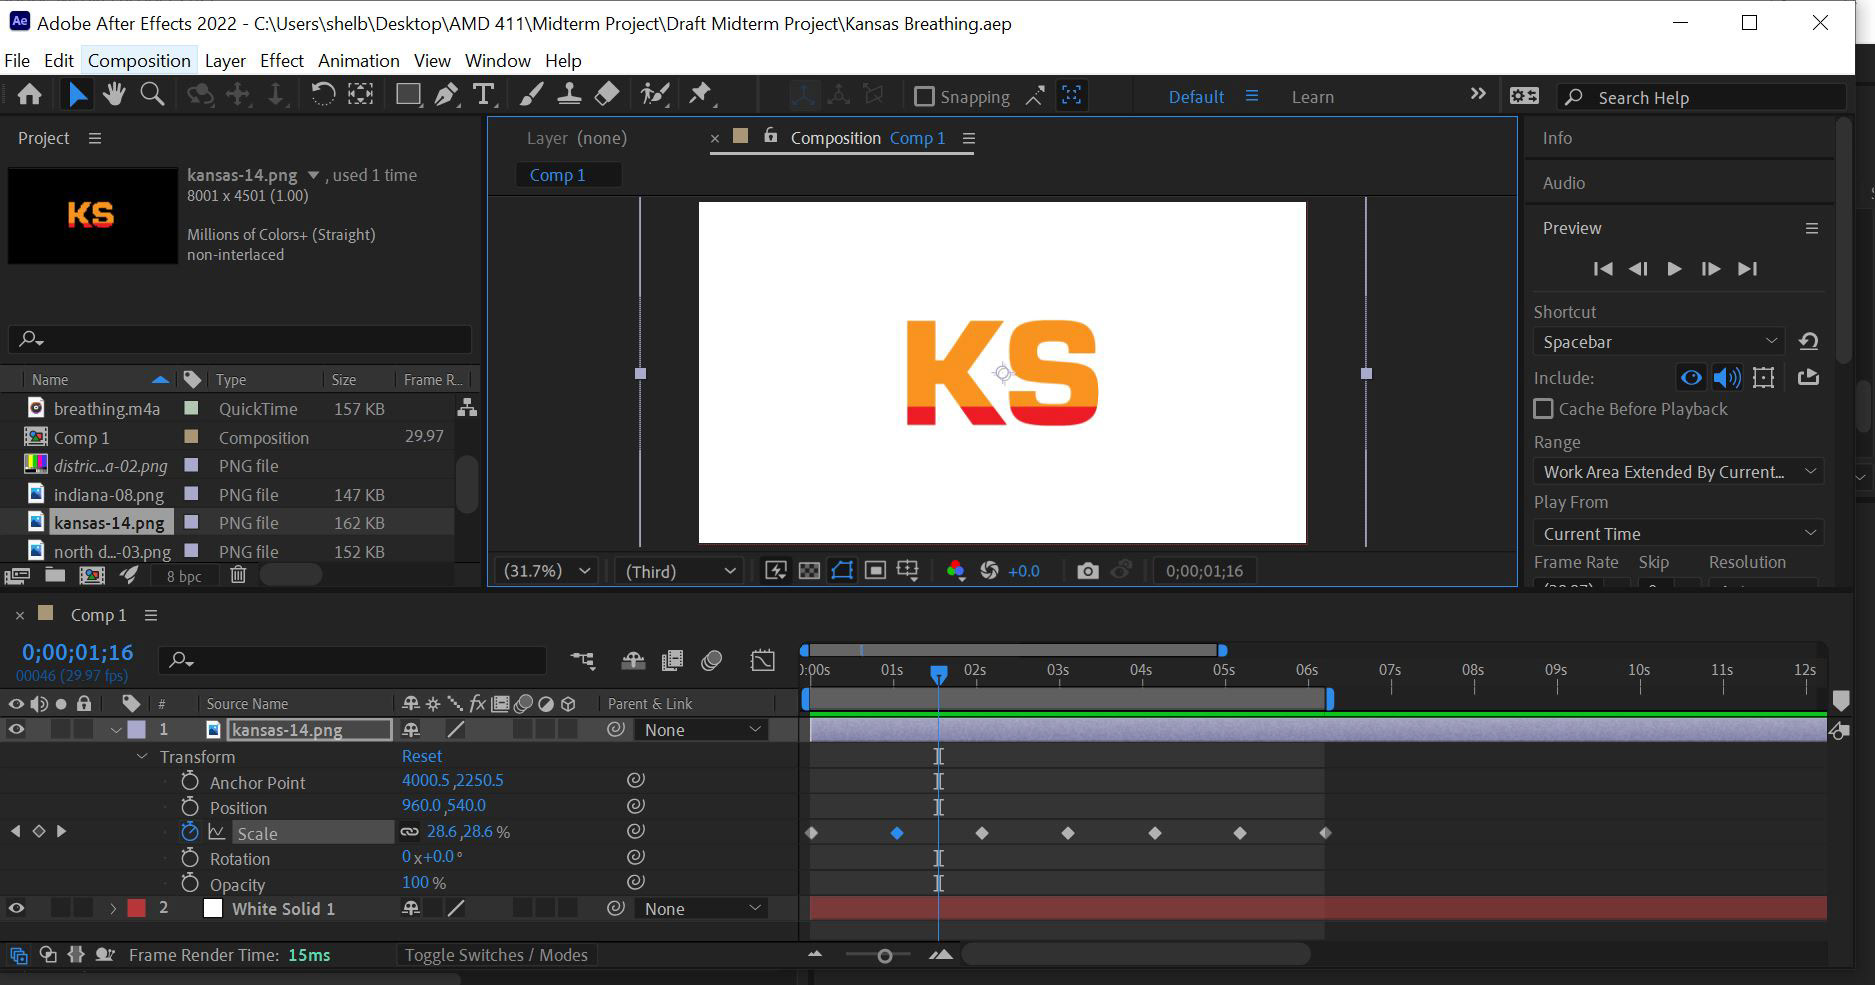
animating the states breathing in After Effects

the first state animation
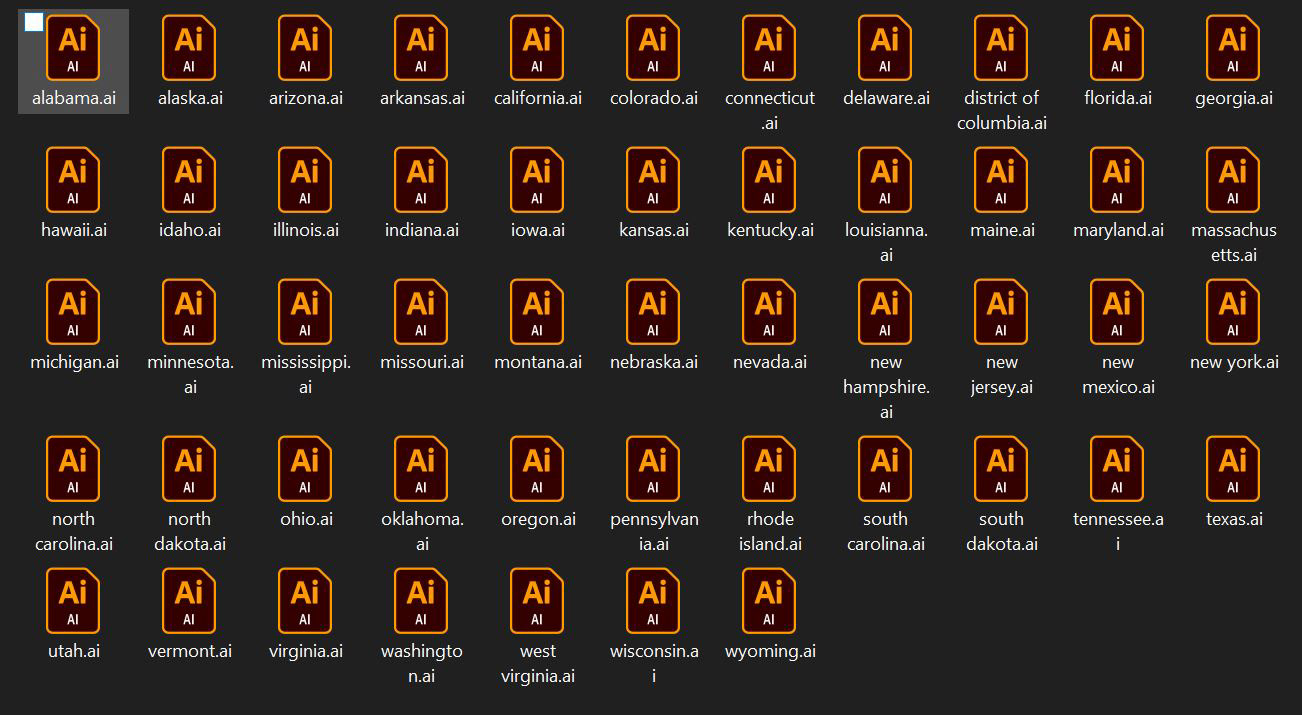
file organization
Works Cited
State Carbon Dioxide Emissions Data. Washington, DC: U.S. Energy Information Administration, 2021. Web. 25 Feb 2022. https://www.eia.gov/envwironment/emissions/state/
Stephens, Becky, Carter J. Betz, Gary T. Green, H. Ken Cordell. Off-Highway Vehicle Recreation in the United States and its Regions and States: A National Report from the National Survey on Recreation and the Environment (NSRE). Athens, GA: USDA Forest Service Southern Research Station, 2008. Web. 25 Feb 2022. https://www.fs.fed.us/recreation/programs/ohv/IrisRec1rpt.pdf